With this short note, I’m starting a series of articles on using Binom tracker’s various functions and their combinations. Some of them may not be noticed by our users, the more interesting will be for them to read this blog and discover all the new features of our product.
Today we will cover the micro-feature which is subtracting the Report row from the Summary row. (link on doc) It works in the following way. For example, you opened the Report on publishers, in the bottom line you see the overall campaign statistics. If you click on any of the rows then the number of clicks, leads, income, cost, etc. of the row will be subtracted from the overall statistics.
How to apply this?
Let’s take the particular case. There’s the campaign with the following indicators:

It has just been launched, and we want to optimise it someway.
Let’s see the offers statistics: 
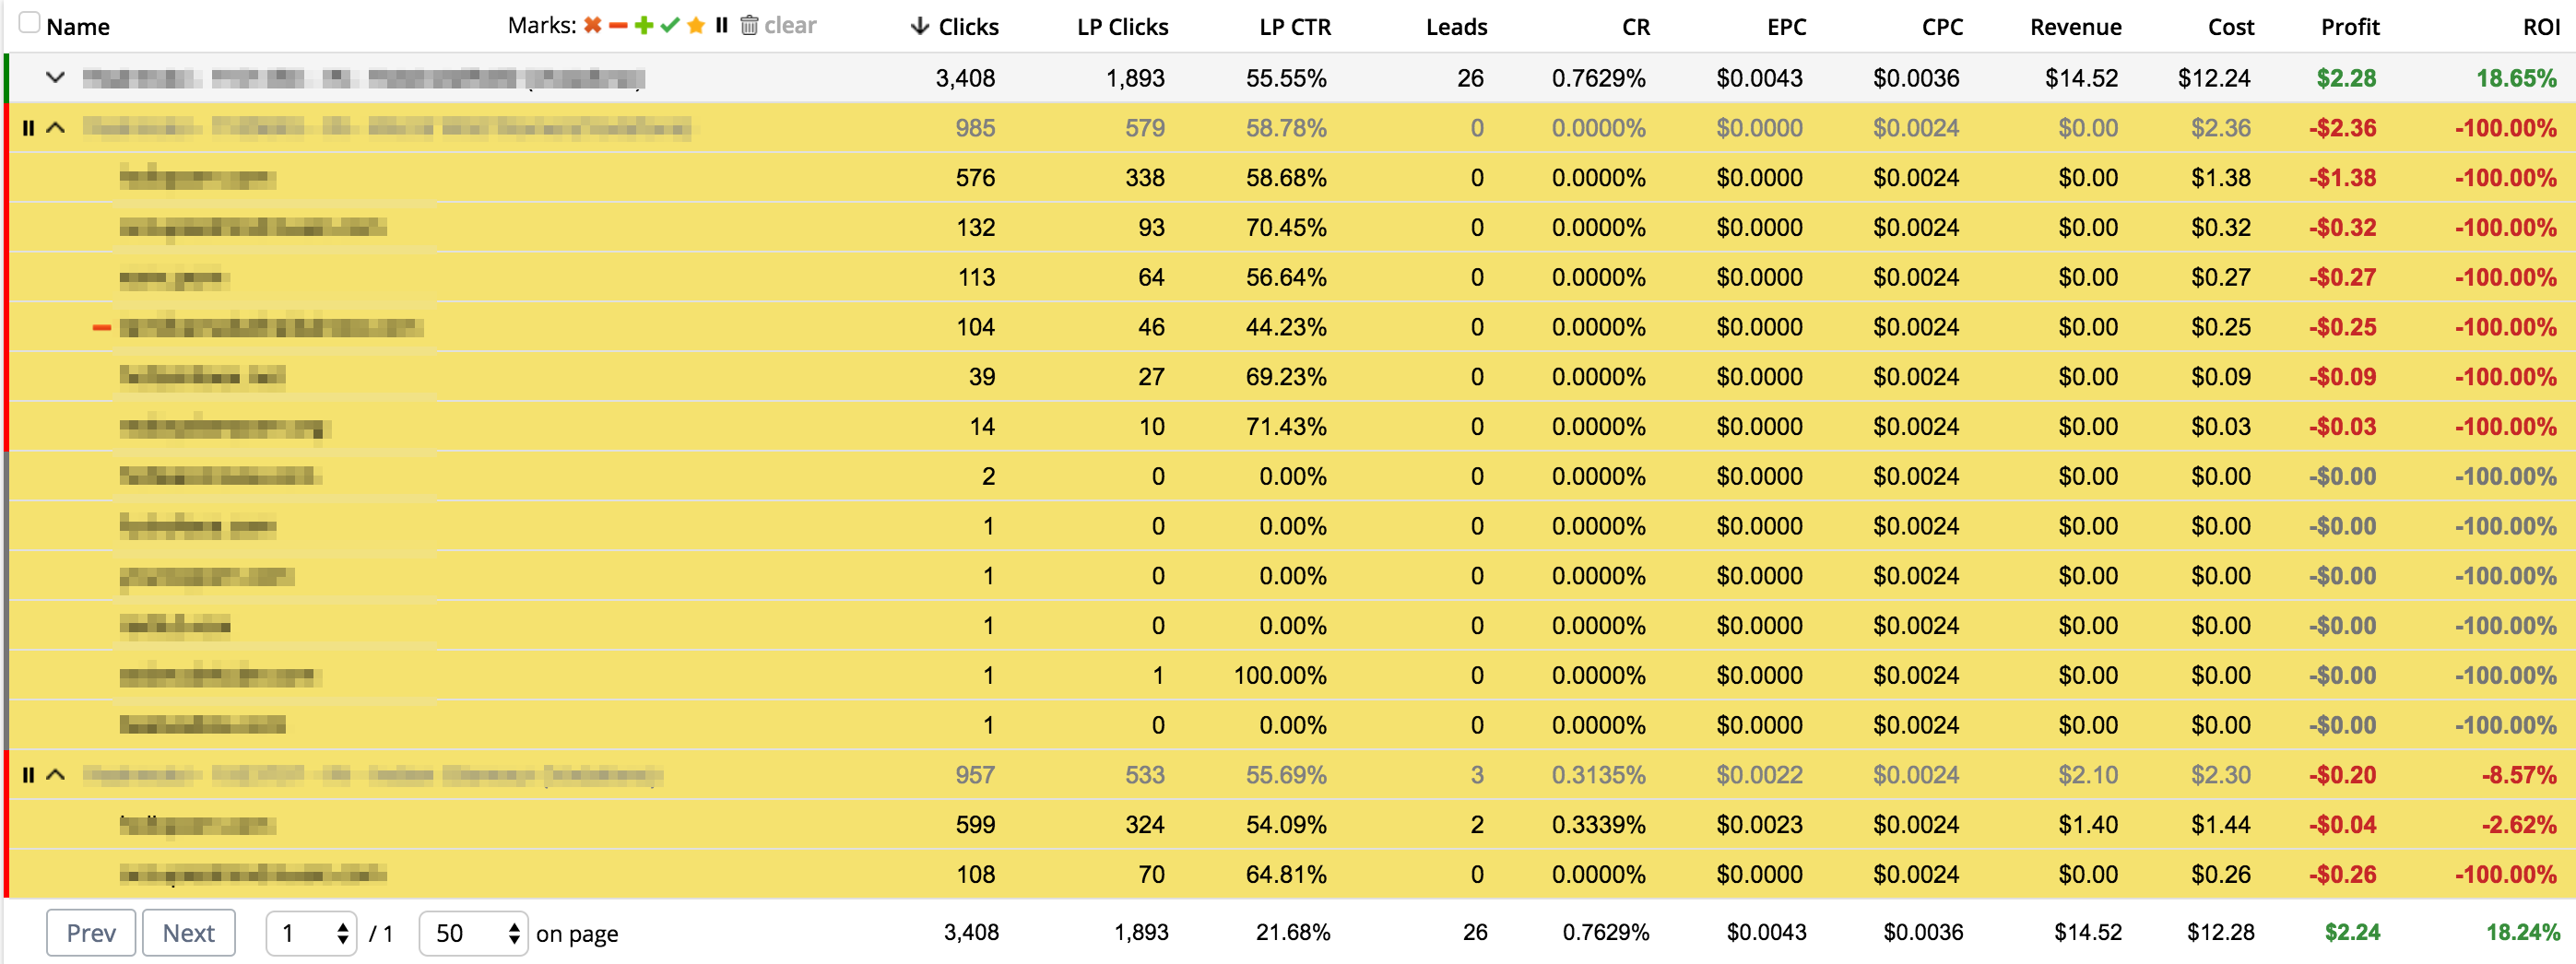
We have noticed that two of the three offers are doing very badly and had stopped rotating them. The tracker marks such offers in a report with the pause icon. For instance, we want to know what the overall statistics would have been if for some reason we had not tested the first (the best) offer. We just mark this line and look at the total amount:

We see ROI -55%
Not much, isn’t it? So test the maximum number of offers for the selected targeting, as not to miss the best ones.

Next, we opening the Report on Publishers, to see if there are any publishers which we want to Black-list.

They are few. On the second row, we see the publisher with the negative ROI. We add it to the Black-list and mark it in the tracker with a minus sign so we wouldn’t forget. We want to know what the final ROI would have been if we had bought traffic without this publisher. Click on the row.

Without it, ROI is about 15% which is a bit better. Next, open the two-level report on offers and publishers and subtract both “minus” offers.

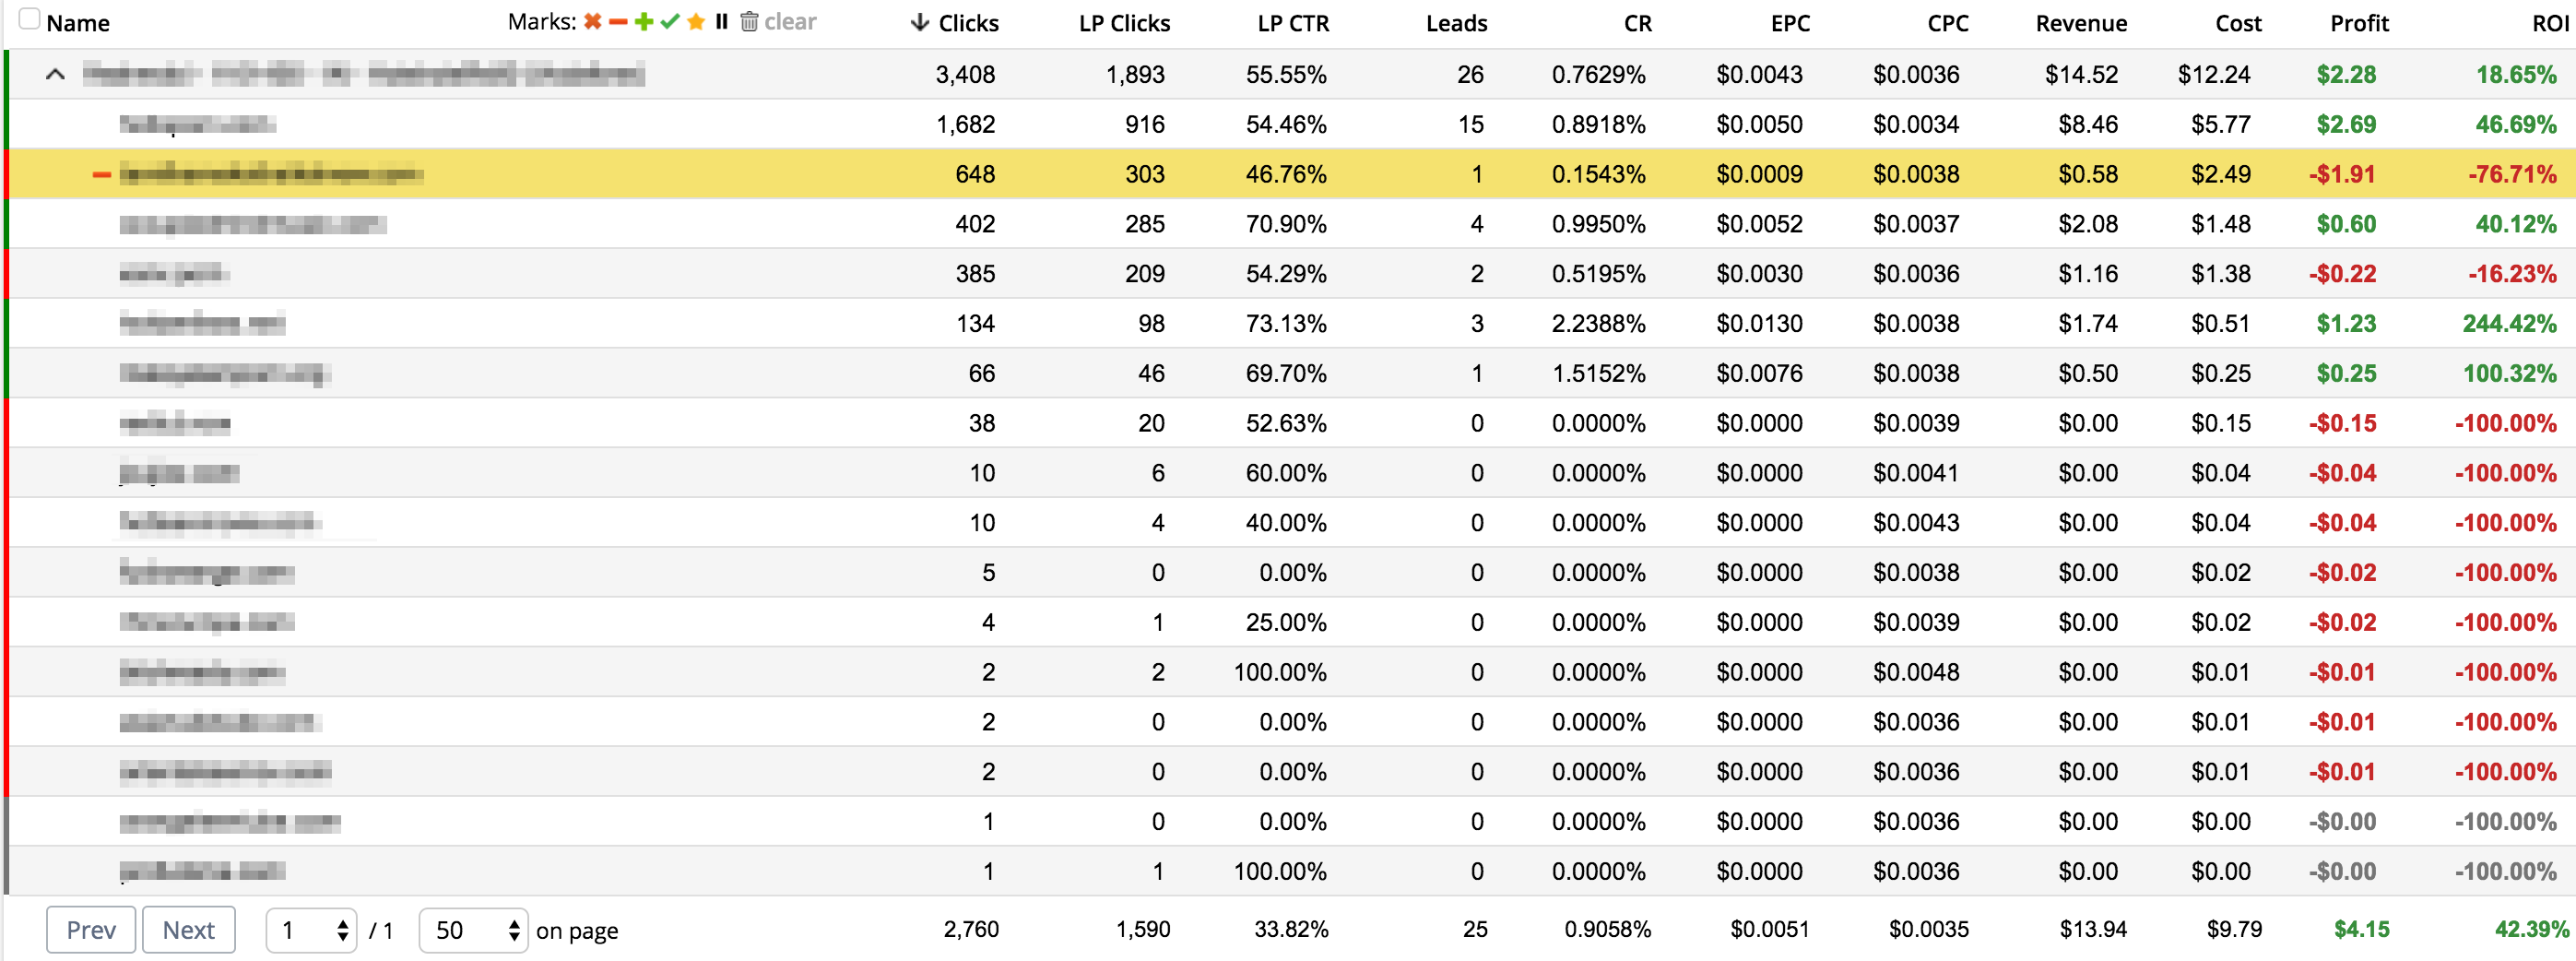
If you click on the top level of the report (offers), all internal rows will be highlighted as well. But we can also subtract the second level rows. For example, let’s subtract the publisher, which we sent to the Black-list earlier from the first offer rows.

In the Total row, we got ROI = 42%. We would have seen such ROI if we had driven traffic to the best offer without one negative publisher, i.e., hypothetically, if we start the campaign after optimisation, ROI would be approximately the same. This simple example illustrates how the small feature detail of the statistics generation can help us optimise our advertising campaigns.